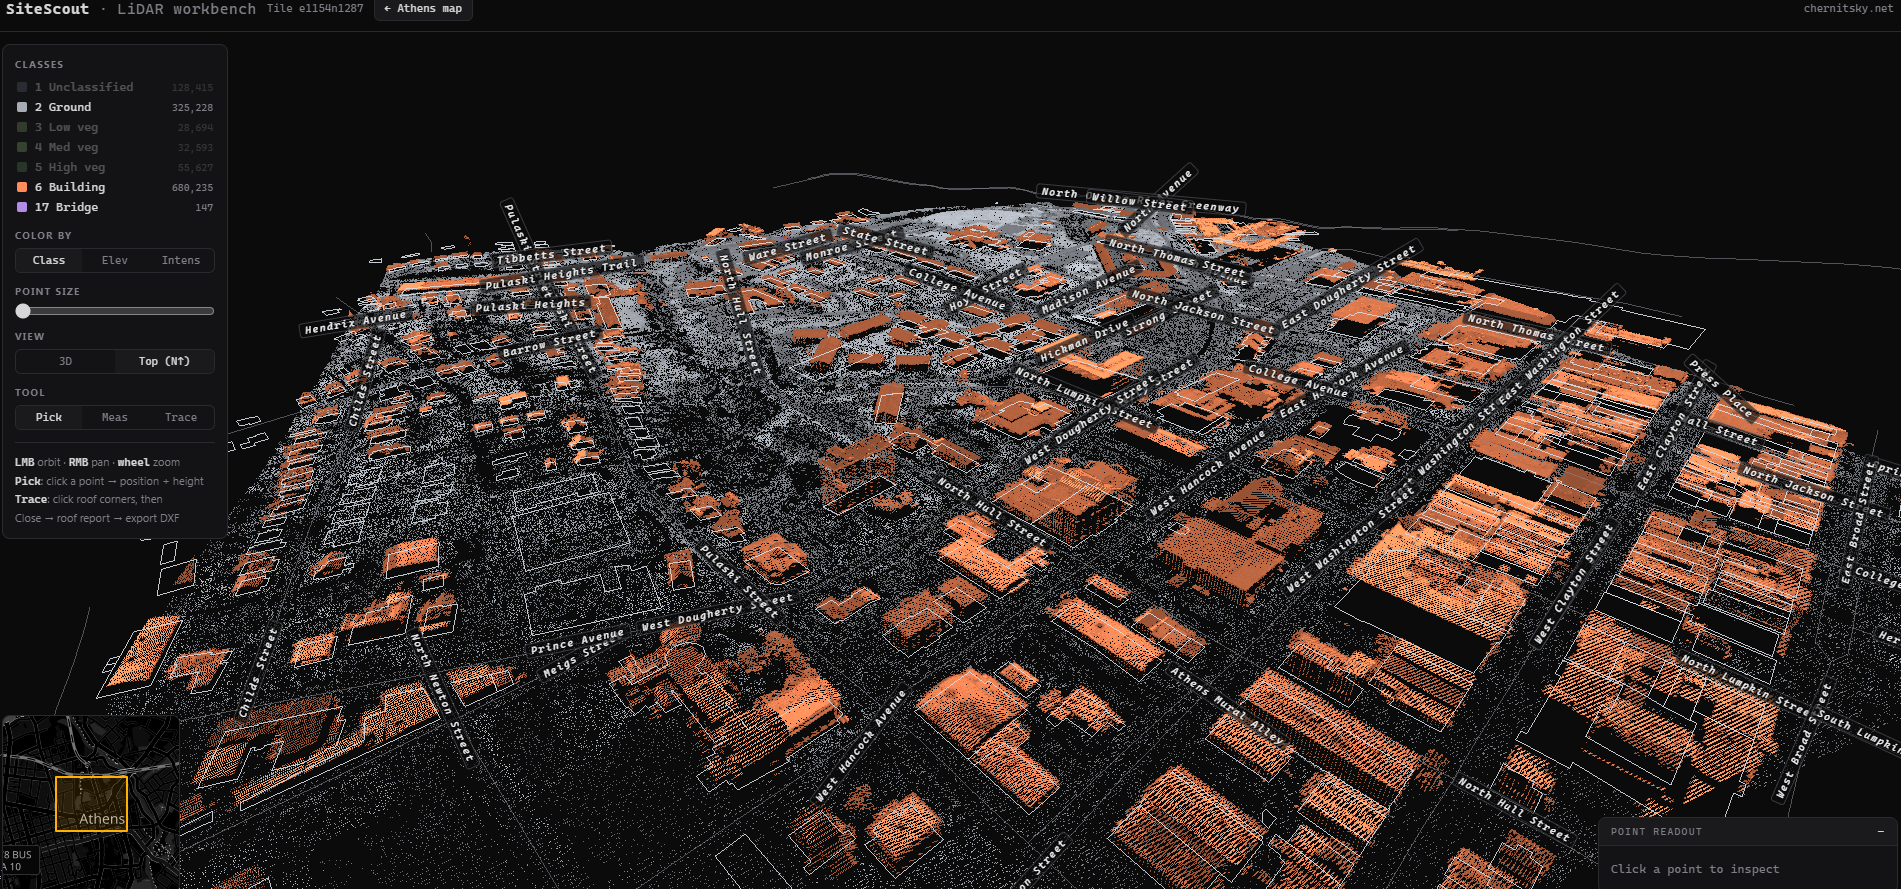
SiteScout is a browser tool for exploring the LiDAR that covers US cities. Pick a spot on a map, open the point cloud right there, and read real site information out of it — building heights, roof and foundation elevations, existing grade — all in the coordinate system a local site engineer actually works in. Nothing to install, nothing to convert.
Five coverage areas so far — pick your city:
- → SiteScout Athens
- → SiteScout Atlanta
- → SiteScout New York
- → SiteScout Chicago
- → SiteScout San Francisco
Athens covers the Loop 10 area wall to wall. Atlanta runs from the downtown core outward. New York starts with Manhattan below Central Park plus downtown Brooklyn — the 2017 citywide topobathymetric survey — and grows from there. Chicago opens with the Loop and the lakefront, built on the 2017 Northeast Illinois QL1 survey. San Francisco starts with the Financial District and the Embarcadero on the 2023 USGS survey — at 0.15 m pulse spacing, by far the densest data in the lineup, fresh enough to include the current skyline. The rest of this page is detail for anyone who wants it; the links above are the main thing.
The cloud itself, inside Civil 3D
For those who want more than footprints, the viewer exports the current square as an .sst file — the point cloud with classes, full 16-bit intensity, and the ground grid, all in the city's state-plane feet. A free companion plugin, ScoutCloud, opens that file directly in Civil 3D: the cloud lands exactly on the site, you can snap to it, read elevations, and build an existing-ground surface or COGO points from it in one command.
Pick a point, choose a radius, click Cloud → .sst in the viewer, then SCOUTATTACH in Civil 3D. The same .sst now comes from every source, both the city viewers here and the live-3DEP builds on SiteScout Anywhere, and squares exported before this release still attach fine. One signed .arx per release, nothing else to install:
Why it exists
Contour services are great for surfaces, but a classified point cloud carries far more: where a building actually sits, how tall its roof is, what the grade is around its foundation. SiteScout reads that out directly, and does the coordinate work for you.
The source clouds arrive in whatever the survey delivered — Conus Albers meters for Georgia, UTM meters for New York and Chicago, a local county system for San Francisco. SiteScout reprojects everything to the local State Plane zone in US survey feet on the fly, accurate to under 0.01 ft across a tile: Georgia West (EPSG:2240) for Athens and Atlanta, New York Long Island (EPSG:2263) for the five boroughs, Illinois East (EPSG:3435) for Chicago, California Zone 3 (EPSG:2227) for San Francisco. Every readout is already in the system your drawings use, and traced geometry exports in it too. You just read feet.
What you can do
- Pick any point to read its easting, northing, elevation, the interpolated ground beneath it, and its height above ground.
- Measure between two points for horizontal distance, elevation change, slope distance, and grade.
- Trace a building outline by clicking its roof corners. On close, SiteScout reads the classified building returns inside the outline and reports peak roof, 95th-percentile roof, and existing ground along the perimeter — min, max, and average. The difference is the building height.
Ground elevations come from a 2 m grid built from every ground-classified return, with gaps under buildings filled from the surrounding grade — exactly the existing grade you want under a foundation.
Export to Civil 3D
Traced footprints export to a DXF in the local state-plane feet that drops straight into a drawing at 0,0 with no transform. Each footprint becomes a closed 3D polyline at true ground elevation on a FOOTPRINT layer, a matching outline at peak-roof elevation on a ROOF layer, and a text label with the roof and grade numbers on an ANNO layer.
Finding your way around
Each city page keeps its map restricted to its own coverage area and styled to match. Search an address to fly to the tile that contains it — and once a tile is open, search again right inside the 3D view to highlight a specific building. Building outlines, street names at their intersections, and house numbers on zoom are drawn draped over the terrain, and a vicinity map in the corner keeps you oriented. Tiles carry deterministic labels — ATH001–ATH320 over Athens, ATL001–ATL840 over Atlanta, NYC0001–NYC2173 over New York, CHI0001–CHI0783 over Chicago, SFO0001–SFO0400 over San Francisco — so a square you reference today means the same ground tomorrow.
Built by Ilia Chernitsky.